Forget about football teams, the new state rivalry is all about life expectancy. A report from the Centers for Disease Control (CDC) breaks down healthy life-expectancy (HLE) by state. Hawaii dominates the list, while Southern states fall short.
The report uses data about mortality, morbidity and health status to estimate the expected number of years lived in good health for people, beginning at age 65. These types of estimates are used around the world to predict future health service needs and to identify trends or inequalities in each country.
Until now, very few studies for the US have broken down healthy life expectancy for each state.
Life expectancy varies by sex and race
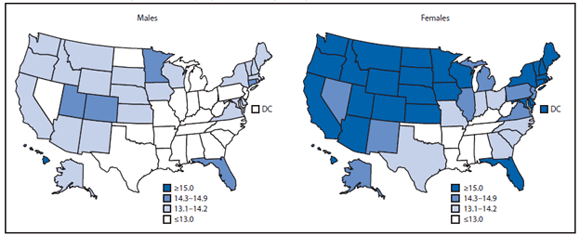
For males, HLE estimates at 65 years ranged from a low in Mississippi of 10.1 years, to a high in Hawaii of 15 years. But for females, those numbers were 11.4 years in Mississippi and 17.3 years in Hawaii.According to the report, healthy years lived beyond age 65 were:
- Greater for females than for males, and
- The difference ranged from 0.7 years in Louisiana, to 3.1 years in the Dakotas.

Healthy life expectancy for males and females in years from age 65, by state, 2007-2009. Source: CDC
The report does, however, analyze the state-by-state numbers for both blacks and whites, and it reveals that HLE was greater for whites than blacks in almost every state, with the exceptions of Nevada and New Mexico. Iowa had the largest difference in HLE between whites and blacks at 7.8 years.
Why the state-by-state difference in life expectancy?
While the CDC says it is not possible to flesh out why some states have a higher or lower HLE, the report does, however, suggest that several factors can influence health status later in life:
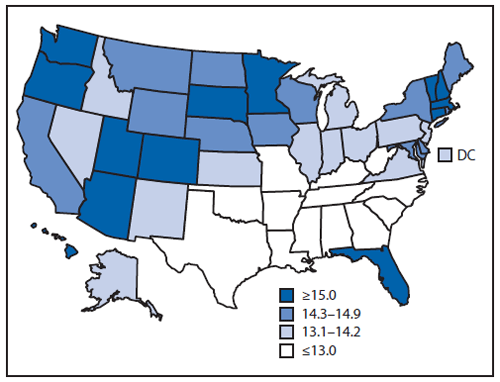
As a general trend, HLE rates from 2007-2009 were lowest in the Southeast, with higher rates dotted in the Southwest, Northeast, Northwest, Florida and Hawaii. Source: CDC
No comments:
Post a Comment